Facts and Figures
When using any of our statistics please reference Age UK London.
Population
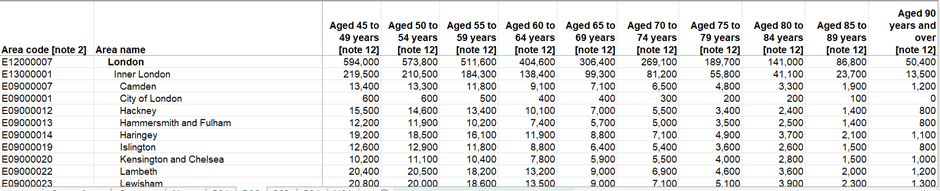
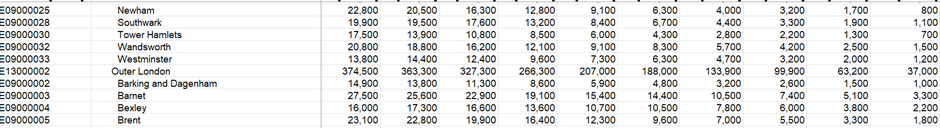
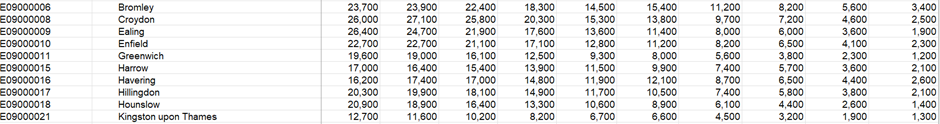
There are 2.5 million people aged 50 or over living in London. Of this number, 1.1 million are aged over 65 and this is projected to increase by 86% in the next thirty years. This is a far quicker rate than younger age groups.[1]
There are 130,000 people aged over 85 in London, and that is expected to increase to 180,000 over 85 by 2024, which is a 38% increase in 10 years London’s population, like that of the rest of the UK, is getting older.
Diversity
London’s older population is diverse; for instance, of the 1.1 million Londoners aged 65+, 27% are from Black, Asian and Minority Ethnic (BAME) communities. This figure rises to 39% among those aged 50-64.[2]
51% of Londoners aged 50-64 are female, a figure that rises among the over 65 bracket to 55%. This compares to 50% across the population of London as a whole.[3]
Opening Doors London estimate there are 100,000 older lesbian, gay, bisexual and transgender (LGBT) people in London.
Older Londoners are much more likely to be living with a long-term health condition that affects their daily life. 52% of those aged 65+ are disabled, as are 24% of people aged 50-64. This contrasts greatly with those under the age of 64 in London, for whom the figure is 9%.[4]
Older Londoners speak a broad range of languages and follow a wide variety of faiths and beliefs – 82% of those aged 65+ stated they followed a religion when asked. This figure falls to 75% among Londoners aged 50-64.
Economic Situation
Although London is the richest city in the UK, rates of pensioner poverty are far higher in the capital compared to the rest of England, with 19% of older Londoners living in poverty compared to 14 elsewhere.[5] With living costs in London continuing to rise there is reason to fear that poverty and inequality among older Londoners may increase.
Employment
Employment among Londoners between the ages of 50 and 64, is lower than among those aged 25-49. Although early retirement can account for some of this gap, on a national level, less than a third of those aged 50-64 who are out of work consider themselves retired. More worrying still, the majority of those who didn’t consider themselves retired felt it was unlikely they would ever work again.[6] That said, the employment rate among the 50+ age group is rising in London and is higher than the national level. The employment rate for those over the age of 65 is much lower than younger ages, although the rate of employment for this age group has increased throughout the last decade.[7]
The 2011 Census recorded that 19% of working Londoners were self-employed, with this figure rising to 36% among the 65+ age bracket.
Contribution of Older Londoners
The 2013 GLA report ‘The Economic Contribution of Older Londoners’ found that the paid work of those aged 50+ in London contributed £47 billion annually to London’s economy, which is a huge contribution to the capital. It also stated that Londoners aged 65+ contributed £6.3 billion annually to London’s economy through paid work, volunteering, as carers and looking after grandchildren. It is vital to highlight and celebrate the contribution made to active communities in the capital.
What can’t be captured by data are the experiences, knowledge, dynamism and energy that London’s older population brings to the city, all of which are an invaluable contribution to the capital.
London population by borough
Source: Census 2011
London Borough |
Population 50+ |
%50+ |
% Female 50+ |
% Male 50+ |
Population 65+ |
Barking and Dagenham | 43,700 | 24% | 54% | 46% | 19,200 |
Barnet | 102,700 | 29% | 54% | 46% | 47,400 |
Bexley | 77,800 | 34% | 54% | 46% | 47,900 |
Brent | 77,800 | 25% | 52% | 48% | 32,600 |
Bromley | 108,200 | 35% | 54% | 46% | 51,900 |
Camden | 53,500 | 24% | 53% | 47% | 24,100 |
City of London | 2,400 | 32% | 50% | 50% | 1,000 |
Croydon | 103,500 | 29% | 54% | 46% | 44,500 |
Ealing | 86,100 | 25% | 53% | 46% | 36,300 |
Enfield | 86,600 | 28% | 54% | 46% | 39,000 |
Greenwich | 61,300 | 24% | 53% | 47% | 26,000 |
Hackney | 44,800 | 18% | 52% | 48% | 17,300 |
Hammersmith and Fulham | 38,900 | 21% | 54% | 46% | 16,400 |
Haringey | 55,900 | 22% | 54% | 46% | 22,500 |
Harrow | 73,900 | 31% | 55% | 45% | 33,600 |
Havering | 87,000 | 37% | 54% | 46% | 42,400 |
Hillingdon | 78,000 | 29% | 52% | 48% | 35,200 |
Hounslow | 64,500 | 25% | 53% | 47% | 26,900 |
Islington | 43,400 | 21% | 53% | 47% | 18,100 |
Kensington and Chelsea | 44,700 | 28% | 54% | 46% | 19,300 |
Kingston upon Thames | 45,800 | 29% | 53% | 47% | 20,300 |
Lambeth | 59,000 | 20% | 53% | 47% | 23,100 |
Lewisham | 63,300 | 23% | 54% | 56% | 26,200 |
Merton | 52,600 | 26% | 54% | 46% | 23,200 |
Newham | 54,500 | 18% | 53% | 47% | 20,400 |
Redbridge | 76,400 | 27% | 54% | 47% | 33,400 |
Richmond upon Thames | 57,100 | 31% | 57% | 43% | 25,200 |
Southwark | 58,500 | 20% | 56% | 44% | 22,400 |
Sutton | 60,000 | 32% | 53% | 47% | 27,300 |
Tower Hamlets | 39,100 | 15% | 51% | 49% | 15,800 |
Waltham Forest | 61,100 | 24% | 54% | 46% | 25,600 |
Wandsworth | 63,200 | 21% | 54% | 46% | 27,100 |
Westminster | 55,100 | 25% | 52% | 48% | 24,400 |
Footnotes
[1] GLA City Intelligence Unit (2018) GLA Population and Household Projections.
[2] GLA City Intelligence Unit (2018) GLA Population and Household Projections.
[3] GLA City Intelligence Unit (2018) GLA Population and Household Projections.
[4] 2011 Census Table LC3101EWls
[5] Trust for London (2017) London’s poverty profile.
[6] Department for Work and Pensions (2014) Fuller Working Lives - Background Evidence.
[7] ONS Annual Population Survey Jan-Dec 2010 and Jan 2015 – Dec 2017.